

A life table changed one of our loss-of-earnings calculations by R1 243 050.
The matter involved a 29-year-old man. His calculated loss was R8 576 800 under Table 6 and R9 819 850 under Table 1, a difference of 14.5%. We kept the earnings projections, retirement assumptions, contingencies and all other calculation assumptions unchanged.
For an attorney reviewing quantum, a difference of that size deserves attention. It shows how much can depend on an assumption that may receive less scrutiny than the claimant’s earnings or retirement age.
To understand why, it helps to understand what a life table contributes to the calculation.
What life tables do
An actuarial damages calculation converts future financial losses into an amount payable today. Those losses might include earnings, financial support or the cost of medical treatment and care.
The calculation must allow for the possibility that the claimant, or a relevant dependant, will not survive to receive every projected future payment.
A life table provides estimates of survival at different ages. The actuary uses those estimates to weight future amounts according to the probability that the person will be alive when they arise, before discounting them to their present value.
This is more informative than simply assuming that someone will live to a particular age. Life expectancy is an average remaining lifetime; a life table describes the pattern of survival across those future years.
A table that assumes higher survival generally gives greater weight to later payments. How much that changes the final quantum depends on the amount and timing of the losses being valued.
South Africa’s complicated life-table history
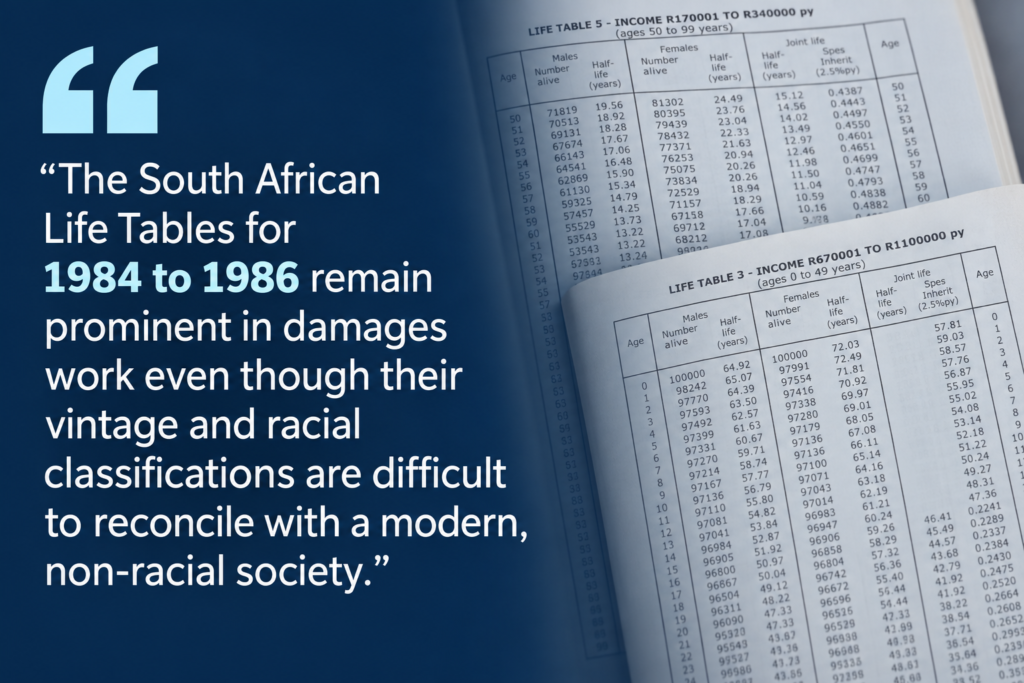
South Africa’s historical life tables reflect the country’s past. During the twentieth century, government statistical departments produced separate complete tables for populations classified as White, Coloured and Asian, while the historical series lacked an equivalent complete table for the African population. The 1984–1986 tables subsequently became widely used in actuarial damages calculations.
The Quantum Yearbook’s six income-related tables attempted to move away from selecting mortality assumptions by race. However, their underlying rates still comprise adjustments and combinations of the legacy White and Coloured population tables.
Six income related mortality bases reproduced in the Quantum Yearbook materials
| Table | Annual earnings band | Mortality basis |
|---|---|---|
| 1 | More than R1 600 000 | 80% of SALT 1984 to 1986 "White" mortality |
| 2 | R1 100 001 to R1 600 000 | 100% of SALT 1984 to 1986 "White" mortality |
| 3 | R670 001 to R1 100 000 | 67% "White" plus 33% "Coloured" mortality |
| 4 | R340 001 to R670 000 | 33% "White" plus 67% "Coloured" mortality |
| 5 | R170 001 to R340 000 | 100% of SALT 1984 to 1986 "Coloured" mortality |
| 6 | Less than R170 001 | 120% of SALT 1984 to 1986 "Coloured" mortality |
Table 2 uses the unmodified 1984–1986 White population mortality basis.
The income categories therefore do not represent six independently observed modern populations.
That history creates a difficult question: how should actuarial evidence developed within a racially classified system be applied fairly to claimants today?
What Singh established
In Singh and Another v Ebrahim (413/09) [2010] ZASCA 145, the Supreme Court of Appeal considered life-expectancy evidence concerning a child severely injured through medical negligence.
The court recognised the attraction of Koch’s attempt to remove race from table selection, but found that the evidence did not establish the reliability of his alternative assumptions in that case. It accepted the 1984–1986 White male tables as the best available basis on the evidence, using them to exclude a racial component from the calculation.
Later, in AD and Another v MEC for Health and Social Development Western Cape [2016] ZAWCHC 116, the court explained that this policy supported using Table 2, rather than the other tables, for a child classified as Coloured, in the absence of new data. It also considered newer demographic evidence when determining the child’s life expectancy.
The position continues to develop. In Tobi v Passenger Rail Agency of South Africa [2026] ZAWCHC 20, Judge Moosa firmly ruled that using actuarial tables that value poorer lives as shorter is unconstitutional, unfair, and discriminatory. The court highlighted that these methodologies are structurally built on legacy, apartheid-era population classifications and socioeconomic disparities. Adopting them would unconstitutionally perpetuate past systemic inequalities in modern damages awards.
Table 2 consequently has an established place in South African damages practice. However, selecting and applying a mortality basis still requires informed judgement.
What changed in six actual RAF matters
To show the financial significance of this choice, Vector Actuaries reran six completed Road Accident Fund loss-of-earnings calculations using the six life-table bases in the Quantum Yearbook framework.
We changed only the life table.
Comparing Table 1, which assumes higher survival, with Table 6, which assumes lower survival, produced differences ranging from R41 000 to R1 243 050, or 7.9% to 18.6%.
The interactive tool below allows you to examine each matter and compare the results across all six claimants.
Interactive sensitivity analysis
How much can the life table change the result?
Select an anonymised matter to see what happened when the same loss-of-earnings calculation was run using Table 1 and Table 6. Every other assumption was held constant.
Mr Tshimbiluni
Male aged 29Difference in calculated loss
Table 1 compared with Table 6
What this shows: The percentage effect is not ordered neatly by age. It also depends on the timing and shape of the projected loss, retirement assumptions and the relationship between the uninjured and injured earnings paths.
How to read this: The percentage is measured against the Table 6 result. These six matters are illustrative and do not form a representative statistical sample. The comparison demonstrates sensitivity; it does not establish which table is appropriate for a particular claimant.
One finding is particularly interesting: the youngest claimant did not have the largest percentage difference.
The 19-year-old claimant’s result changed by 8.9%. The largest percentage difference, 18.6%, arose in the matter involving a 34-year-old woman, whose calculated loss changed by R577 400. Her projected career after the injury included retirement at age 55.
Age alone therefore did not explain the pattern. The timing of the lost earnings, retirement assumptions and the gap between the uninjured and injured career paths also mattered.
Why future medical expenses can make the differences greater
These six RAF examples concern loss of earnings. In medical negligence and other personal injury claims, a substantial future medical-expenses component can make the differences between life-table results even more pronounced.
Earnings usually end at retirement. Medical treatment and care may continue throughout the claimant’s remaining lifetime. Ongoing caregiving, therapies and replacement equipment can therefore generate costs for many years beyond the end of a working career.
The life table affects the probability attached to each of those future costs. A higher probability of surviving into later years can increase the provision required for continuing care.
Where care costs are substantial and extend over decades, this creates the potential for a larger financial difference between mortality assumptions. The actual effect depends on the claimant’s condition, the duration and timing of treatment, and the cost assumptions.
Our six-case comparison does not measure that additional sensitivity. It demonstrates why the question deserves careful testing when future medical expenses form a significant part of the claim.
Choosing an actuarial provider deserves homework
Attorneys must do their homework when selecting an actuarial provider.
The provider needs a sound understanding of actuarial and statistical principles, together with the modelling expertise to translate earnings projections, survival probabilities and future care requirements into a reliable calculation.
That technical knowledge must be accompanied by an understanding of the South African litigation context and the case law governing damages assessments. An assumption may be mathematically workable while still requiring stronger evidence or a different treatment in the particular matter before the court.
When changing one life table can move a calculated loss by more than a million rand, the quality of the provider matters.
To discuss life-table assumptions in a particular matter, contact Vector Actuaries at instructions@vectoractuaries.co.za.